Far Capital
Far Capital’s Growth Model
Overview
This case study highlights my role as a Growth Analyst and Marketing Strategist for Far Capital, a prominent name in Malaysia’s property industry. My primary task was to help them create a growth model for their demand generation activities through data-driven insights.
Role
Growth Analyst, Marketing Strategist
Background
Far Capital needed a new channel to enhance demand generation, boost revenue, and convert prospects into long-term clients. I was part of a team of 8, responsible for building Far Academy.
My specific role was to simplify their complex marketing strategy, identify bottlenecks, and ensure continuous improvement through data insights.
My key goals were to:
- Understand and simplify their marketing funnel.
- Unify data from multiple sources for a cohesive strategy.
- Build a growth model to track the performance of their funnel.
Process
Understanding Their Funnel
To help me understand their funnel, I started a discussion with the team to understand their current marketing activities. I’ve arranged face to face meeting with the team. The goal is to uncover their
- North Star
- Guardrail Metrics
- Strategy
- Channels
- Tactics
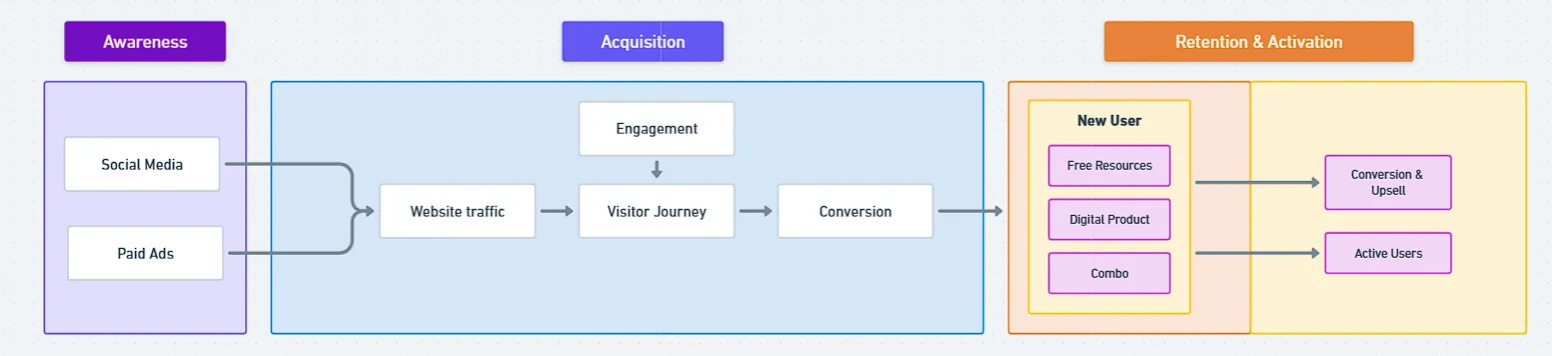
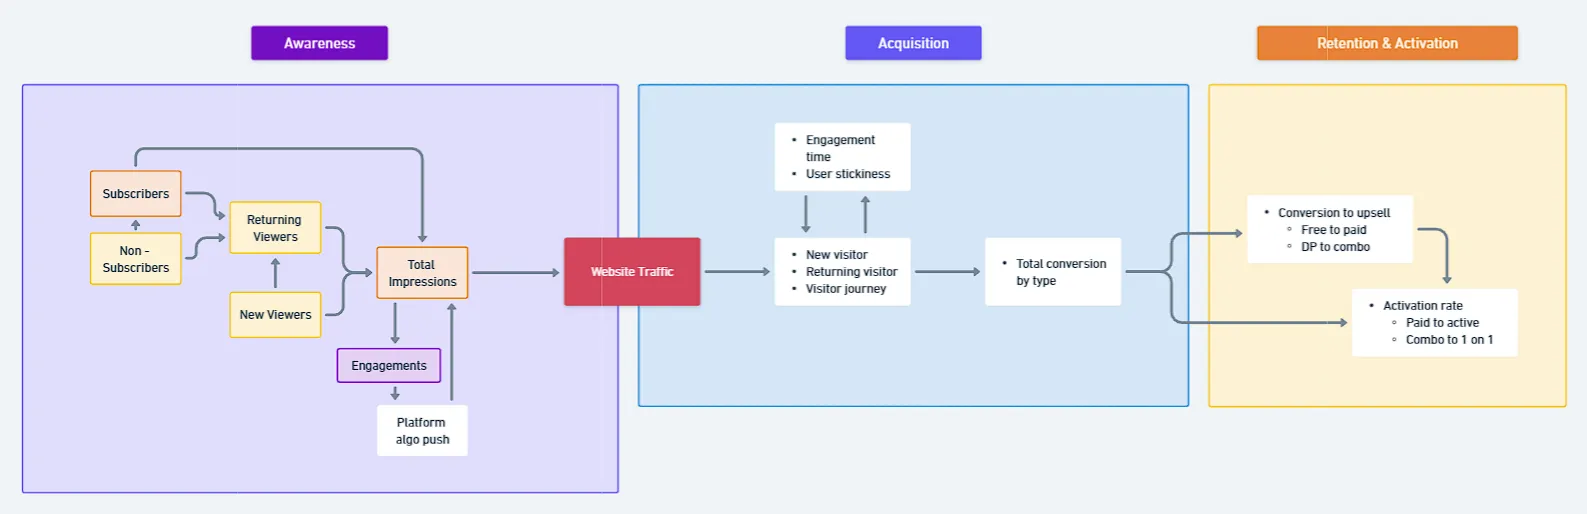
With this information, I developed a user journey map with clear KPIs, which I iterated until it was both actionable and aligned with the business goals.
Create a Journey Map
Once I had a clear understanding of their funnel, I mapped out their entire marketing journey. This map included all relevant marketing activities and the metrics.
Afterward, I expanded these metrics into more detailed sheets that were further refined and optimized for regular use by the team.
Interviews and Simplification
I conducted interviews with the marketing team to further refine the strategy, focusing on translating complex plans into digestible elements like:
- North Star Metric
- Guardrail Metrics
- Funnels and KPIs for each funnel
Created Sheets
Given the company’s low data maturity, a significant part of my work involved manually sourcing data from multiple platforms, including:
- Hootsuite (social media data)
- Google Analytics 4 (website and conversion metrics)
- Google Search Console (SEO performance)
- Meta Business Manager (advertising data)
- Brevo (email marketing insights)
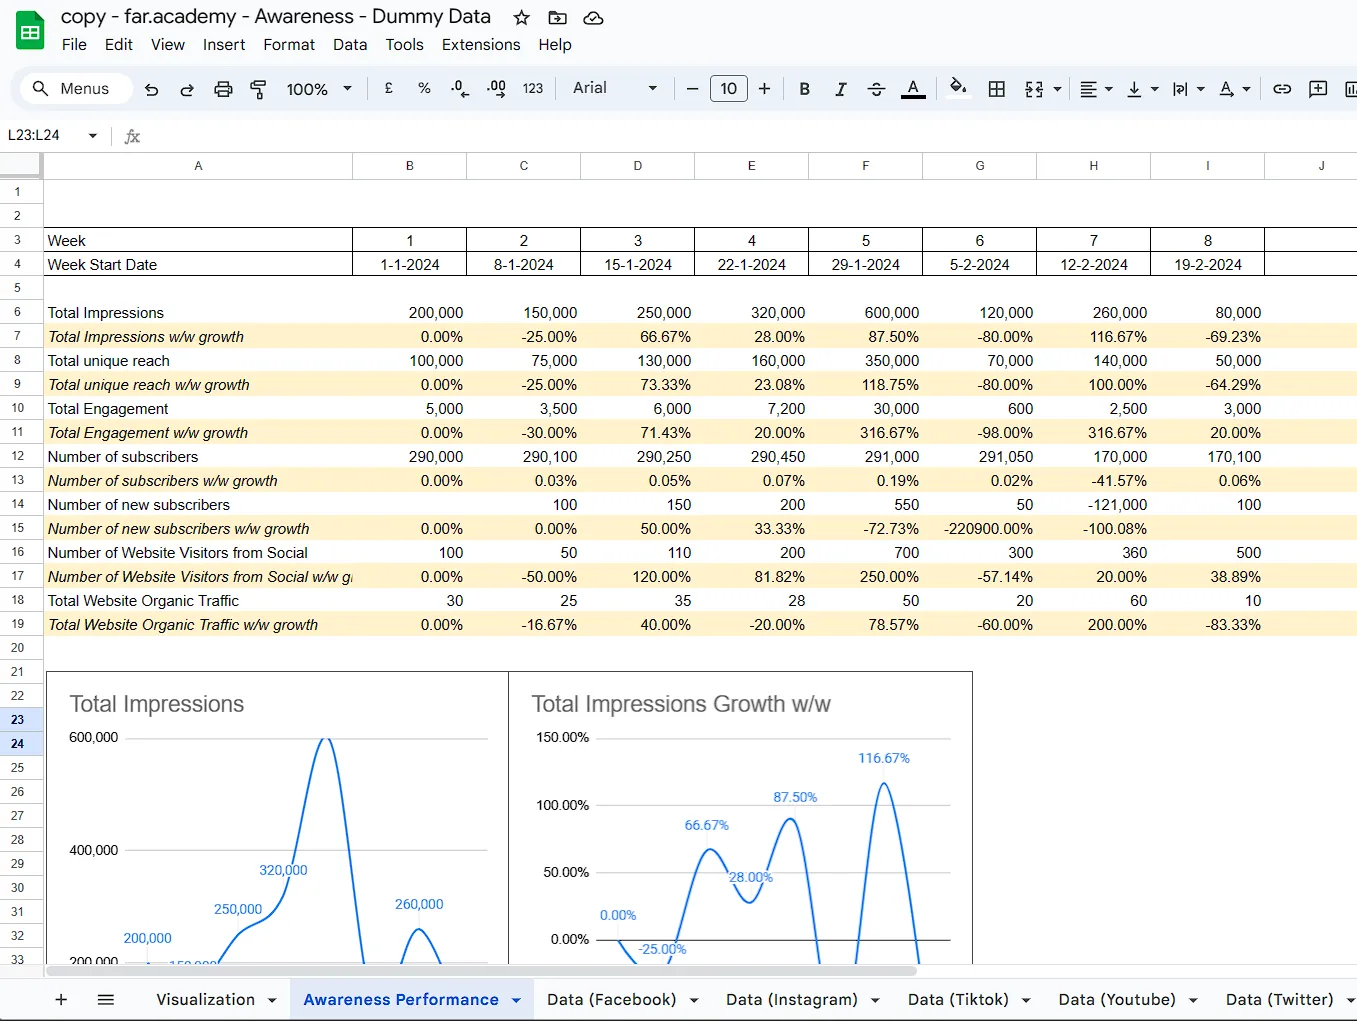
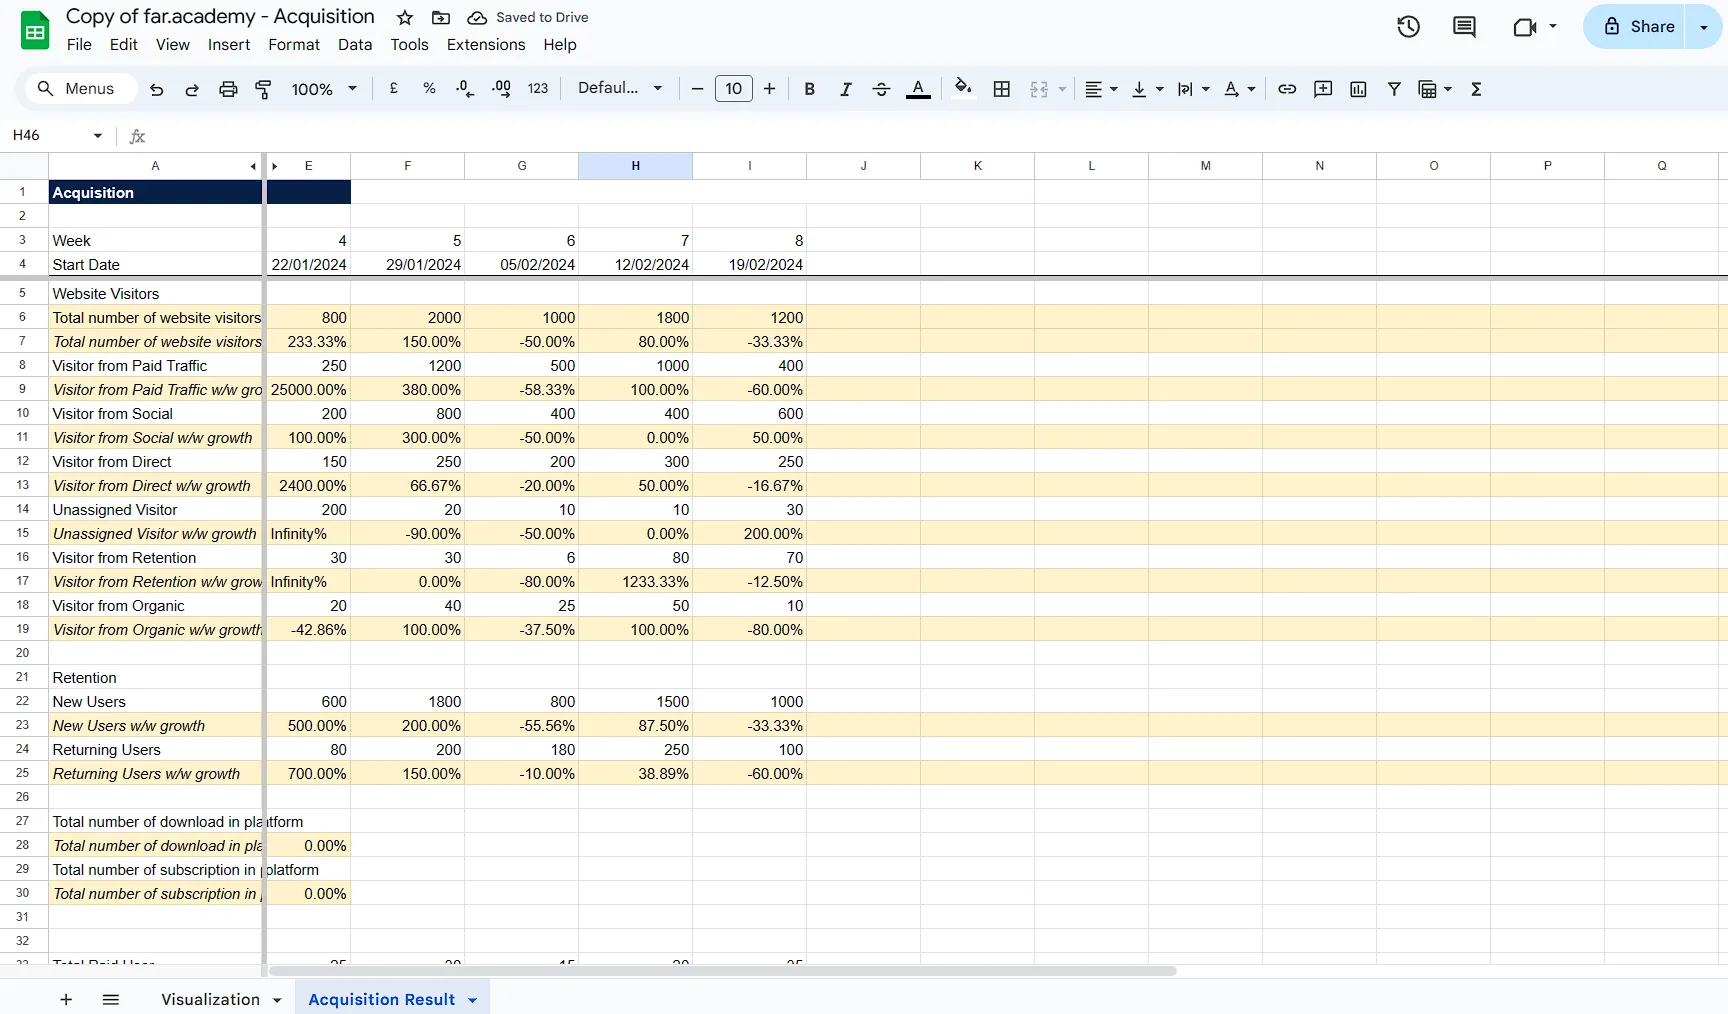
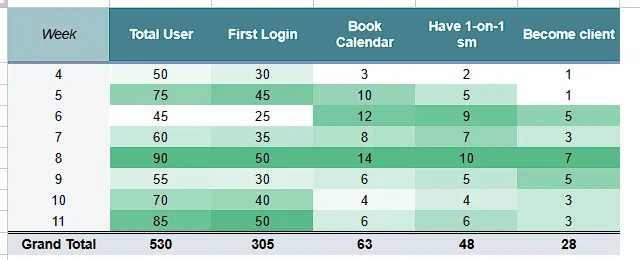
Each funnel’s metrics were then documented in separate sheets.
Solution
- Created individual sheets for each funnel with clear KPIs.
- Consolidated data from multiple sources into a unified view using tools like Hootsuite and Google Analytics.
- Implemented data visualization tools for easy interpretation of the data.
- Weekly workshops were established to review the data and optimize performance.
Deliverables
- Detailed sheets for each marketing funnel.
- Data visualizations to simplify insights.
- Ongoing workshops to ensure continuous improvements.
Outcome
- The team gained the ability to continuously improve their marketing activities using data-driven insights.
- Data visualization allowed stakeholders to quickly and easily interpret key metrics.
- As a result of these efforts, Far Capital achieved a five-figure revenue increase within 3 months.